
Content and Conversion: The Impact of Visual Stories
Often, when we speak to brands about content and conversion rate optimization, the focus is on mid- or bottom- funnel changes. Here are some of the usual questions we get:
- How can we reduce checkout friction?
- Are our product pages creating barriers to add to cart?
- Are our filtering and faceting functions optimized for our customer’s needs?
While these are certainly critical elements in the purchasing funnel, merchants often fail to see the relationship between content and conversion.
Many brands tend to view conversion optimization and funnel improvement through the lens of their technical components, while curated content, guides, and visual catalogs tend to be considered as “nice to have” compared to the aforementioned critical conversion elements.
The Conversion Funnel
When we think of a well-rounded site conversion funnel, it includes everything from decision making (the inspiration) to selection and eventually a purchase. Ideally, it looks something like this:
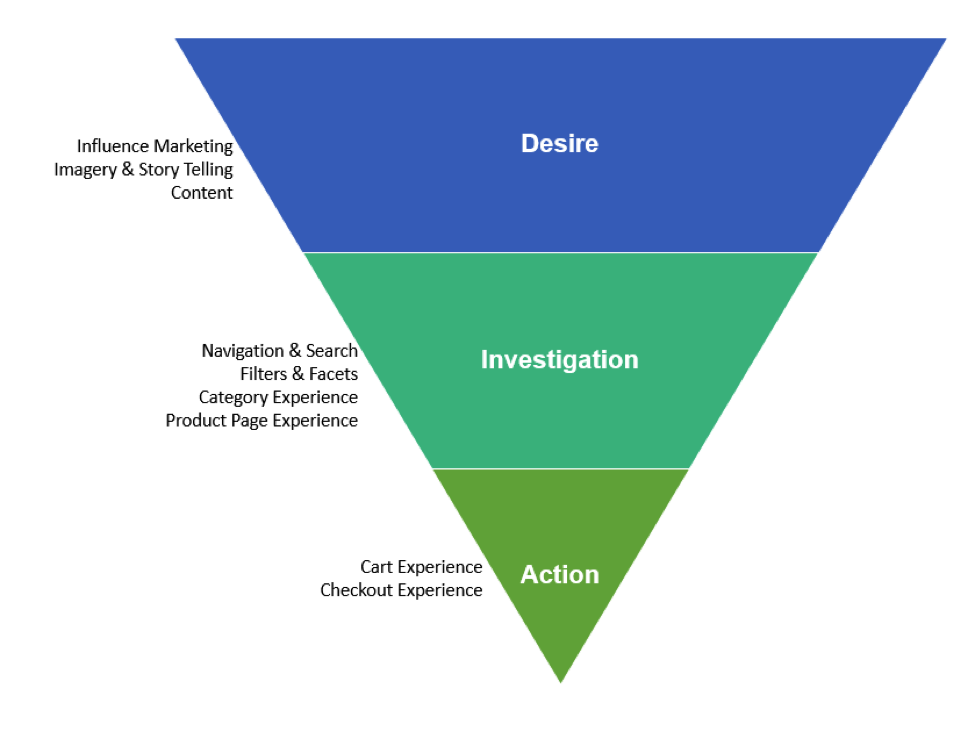
As you can see above, the inspirational elements of the customer journey are the first step on the path to conversion. Shoppers in this stage of the funnel need to be engaged with content, imagery, and experiences that will inform and guide their purchasing decision. This is where content brings value to the conversion funnel.
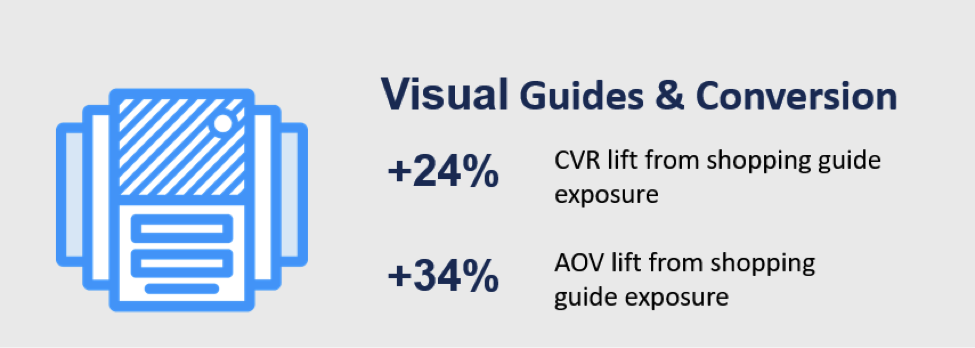
To measure the impact of content – let’s say, exposure to a visual shopping guide – on conversion, we segmented a blind sample of brand data from a few of our fashion clients.
In aggregate and on each individual retailer sample, we saw content exposure to shopping guides drove a significant lift in both conversion and average order value. Not only did content help drive conversion and compel shoppers to move forward in their journey, but it also compelled them to place larger, more valuable orders.
Methodology and Notes:
Here’s some more info on our mini-study. Three mid-market fashion retailers were measured, giving us a total sample size of 7M sessions. This data is recent: from our early 2018 measurement period. Average order value across this sample was $82.
To approach the creation of each segment, we created a group for users who were exposed to shoppable, guided content using URL parameters. We then set up a control group who was not exposed to this guide content.
Users in both segments had to have a page depth greater than one.
Because of the smaller proportion of traffic driven to the guide sections, this represented a smaller proportion of total sample size. Guide exposed visits accounted for 7% of traffic and 9% of total revenue.