
Canvas: Bringing Web Graphics to Life
Since its inauspicious introduction as a proprietary extension to HTML, Canvas has grown into a standard, universal graphics API. Simpler and generally faster than SVG, Canvas is the preferred engine for powering an ever-growing stable of sophisticated graphics and drawing libraries.
This post aims to educate novices on the history and concepts behind Canvas, and explore the computational geometry required to work with the program. Then we will highlight some key Canvas libraries, showcases, and other interesting resources for developers.
What is Canvas?
Canvas was introduced to Apple’s WebKit layout engine in 2004 and has since been standardized by WHATWG and been adopted across all major browsers.
The canvas element itself defines a rectangular area to draw on with JavaScript. The drawing API is a 2D, low-level, immediate mode interface; its core is a context object, which essentially is a pen drawing primitives such as lines or arcs.
The pen follows orders “blindly” – it has no memory of its actions and no geometric model of its work (aka, no scene graph). This simplicity is what makes Canvas a fast and ideal tool for complex animations in gaming and advertising applications. However, this simplicity requires the developer to manage all geometric programming.
Drawing Primitive Elements
Let’s dive into how elemental drawing on Canvas actually works.
Rectangles and Arcs
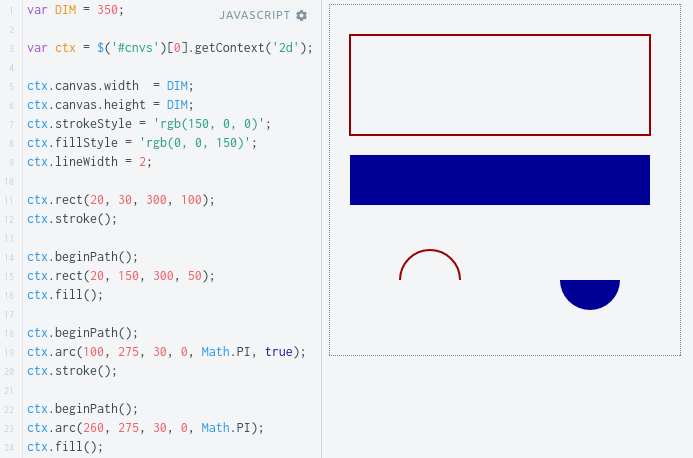
In the above JSFiddle, the context object, ‘ctx’, of a canvas element with ID ‘cnvs’ is being manipulated. Initially, the width and height of the canvas is determined (default dimensions are 300×150).
Next, we demonstrate the drawing styles (fill and stroke) and primitive shapes (rectangles, lines, and arcs) that Canvas renders.
Rectangles are specified by the upper-left coordinate followed by width and height values. Arcs are determined by their origin, radius, starting, and final angles, with angles given in radians from the positive X axis. Arcs also have an optional flag for moving counterclockwise.
Lines, Polygons, and Curves
In our Rectangles and Arcs example, how do the stroke and fill actions know where to apply? In Canvas, each successive drawing instruction adds to an implicit path. When a stroke or fill is performed, it applies to the entire path.
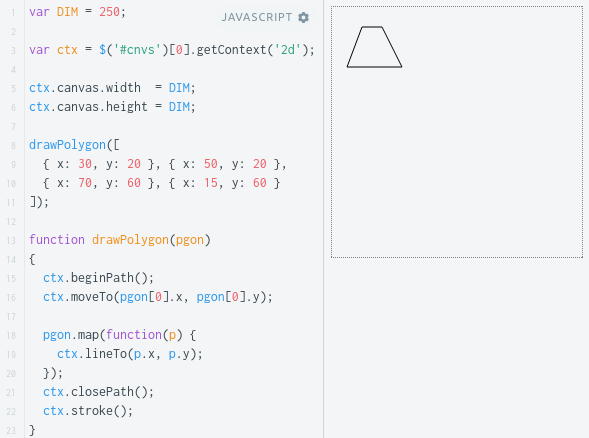
Calls to beginPath() reset the current path, so we invoke this call each time we begin drawing a distinct shape. The context also remembers the last position of the pen, so polygons can be created by drawing lines from one vertex to the next.
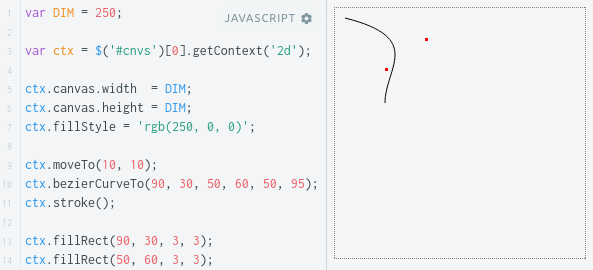
Cubic or quadratic Bézier curves can also be drawn by specifying control points and an end point, with the starting point being the pen’s current location.
Linear Transformations
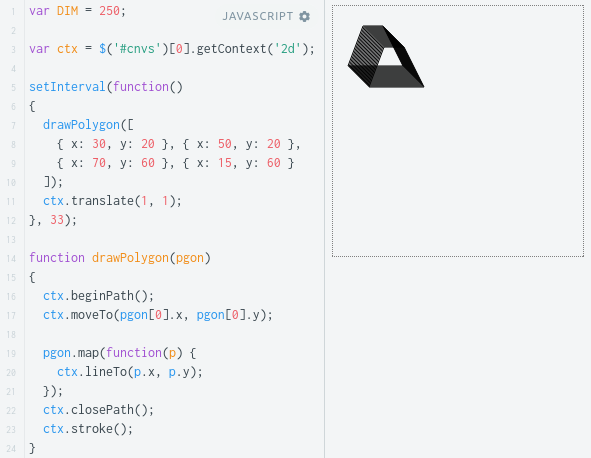
Canvas allows users to apply linear transformations – translation, scaling, rotation, or arbitrary transformation matrices – to the drawing plane. The figure below uses translation and setInterval to animate the original polygon.
Rotation turns the entire canvas around its origin. To rotate an object around its center, we first need to translate the canvas, and then translate it back. Combined with scaling, the rotation effect looks like the below.

Mouse Interaction
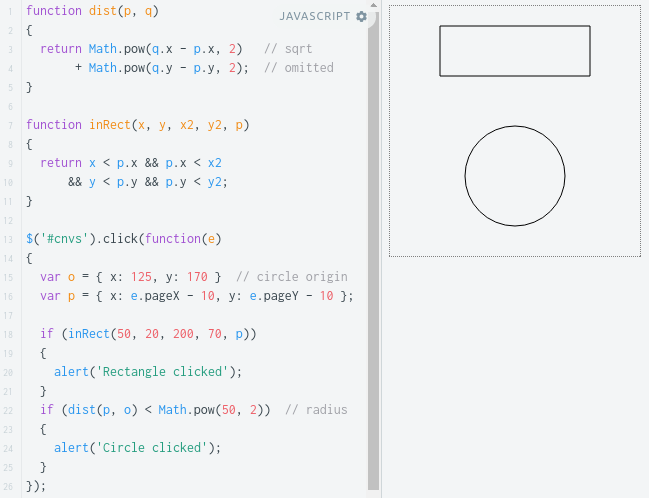
Whether we’re making a game, ad, or infographic, mouse interactivity will be critical. Since canvas has no scene graph built in, how do we detect when a user clicks on a shape? One must calculate whether the click location falls within the shape’s boundaries. When dealing with simple ellipses and rectangles, the task is straightforward, as seen below.
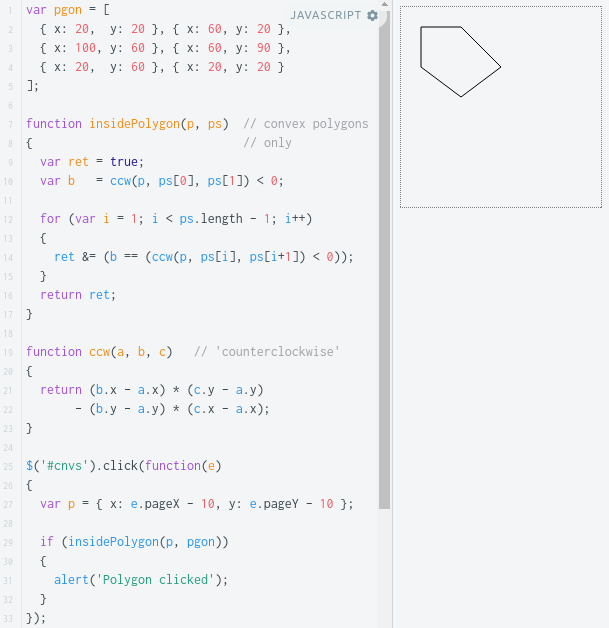
Going a step further, what if we want to know whether a polygon’s interior is clicked? Trying to test whether a point lies inside a general polygon involves tricky edge-cases and numerical issues. Honestly, this testing lies beyond the scope of this article, though we do suggest resources for interested readers. However, we can fairly easily (without vector math) test whether a point is inside a convex polygon.
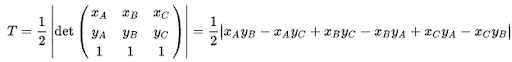
First, observe that a click-point forms a triangle with the endpoints of any edge in our polygon. We can find the area of this triangle by computing the determinant of a matrix.
Or equivalently:
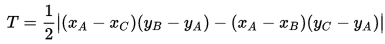
Instead of taking the absolute value, consider the signed quantity. The sign is determined by whether triangle vertices A, B, and C are given in clockwise or counterclockwise order.
What really matters is that if – and only if – point A lies inside a convex polygon, then the endpoints B and C of all the polygon’s edges will give the same sign for triangle ABC. We can implement this test like so:
Further Resources
In this post, we’ve only scratched the surface of the Canvas API’s functionality. Features such as text and bitmap drawing, compositing and clipping, stroke styles, and pixel manipulation are all powerful tools that we will speak more on at a later date.
For now, the following is a briefly annotated list of resources expanding on these topics, exposing you to libraries that build on Canvas, and applications showcasing Canvas.
- The Mozilla Developer Network’s Canvas API page offers a comprehensive API reference, extensive tutorial, and examples of basic and advanced animation.
- Paper.js is a vector graphics framework based on (and compatible with) the Scriptographer plugin for Adobe Illustrator. It includes a basic scene graph, vector geometry, UI events, path objects, and animations. It’s particularly popular and effective at creating brushes for free drawing.
- BitmapDataChannels is a port of the BitmapData class from Adobe Flash. It provides typical pixel-level functions like blending, convolution, compression, and collision detection.
- Fabric.js is an extensive library with models for geometric primitives, polygons, object grouping, shadows, image filters, brushes, gradients, text, and even UI widgets like text boxes. It can also perform SVG rendering and scene serialization.
- Processing.js is a closely-tailored JavaScript port of Processing, a domain-specific language designed for visualization. In addition to the usual 2D primitives and vector operations, it supports basic 3D objects, lighting (including material properties) and perspective projections.
- Origami.js is a library that supports styling objects with CSS. It can be a productive tool for designers with less JavaScript experience.
- Rekapi provides an actor-and-keyframes animation model. It can render either to canvas, or to CSS3 keyframes for enhanced performance.
- SceneGraph.js is a high performance, cross-browser scene graph implementation for canvas. It supports advanced features such as caching, data sharing (for memory optimization), and a particle system.
- JSXGraph is a robust geometry library produced by the University of Bayreuth. Its API is a more abstract version of SVG, modeling concepts from Euclidean and projective geometry. It also supports differential equations, turtle graphics, and Lindenmayer systems. It can render to SVG, VML, or Canvas.
- Jakub Hampl has written a tutorial on writing a simple scene graph on top of Canvas.
- Perfection Kills has an in-depth, excellent write-up on implementing brushes for free drawing.
- DeviantArt hosts the showcase-drawing application Muro, which supports layering and a variety of brush patterns and textures.
- Bryan J. Bell writes a great blog covering geometric algorithms in a variety of industrial-strength libraries, including CGAL and the Java Topology Suite. In addition to major problems like finding closest pairs of points, convex hulls, and segment intersections, he discusses ways to overcome numerical and degenerate case issues. He also discusses the ray casting algorithm, which can be used to generalize this article’s point-in-polygon technique to non-convex simple polygons.